Recommendation systems intro
Pooja has joined a quick-commerce app in Tiruchirappalli as a data fresher. Her manager opens the home screen and points at the "You may also need" row. Every customer sees the same five items today, he says. The big apps show my wife different things than they show me — why can't we? The order history sits in one table: who bought what, and when. By Friday, Pooja must turn that table into personal suggestions, and prove they beat the current list.
- Feeds, shopping, OTT and music apps in India all run on ranked lists, and freshers inherit these systems in year one.
- "How would you build people-also-bought?" and "how do you measure it offline?" are a standard interview pair — this module answers both.
- The core maths is one you already own: the cosine score from 0.7 and 3.4, pointed at a purchase table instead of text.
Open any big Indian app tonight and count the ranked lists. The shopping feed, the OTT home row, the next song, the reels queue — software picked each one for you. A recommender system — software that ranks items for one specific user, based on that user's past behaviour. The input is history; the output is a short list in a fixed order. India's largest apps are, at their core, machines for producing such lists.
Start with the least glamorous model in this course. The popularity baseline — recommend the most-bought items to every user, the same list for everyone. It sounds too basic to matter, yet it is genuinely hard to beat. Items become popular because many people want them, so the bestseller list is a decent answer for a large share of users by construction. Every recommender you ever build must first prove it beats this list.
Old tutorials frame the task as rating prediction: guess the stars a user would give. Real apps frame it as ranking: put five items in front of the user, and win if one gets tapped. Nobody at a quick-commerce firm cares whether your model predicts 3.8 stars for atta. They care whether atta earned a slot in the "You may also need" row. This module uses the ranking frame throughout.
The raw material is one table. The user-item matrix — rows are users, columns are items, and each cell counts how often that user bought that item. Collaborative filtering — recommending from the patterns in this matrix: find users whose rows look like yours, and offer what they buy that you do not. The measure of "looks like yours" is cosine similarity on the rows — the normalised dot product from 0.7, the same score 3.4 used for semantic search. Same mathematics, different matrix: 3.4 compared meaning vectors from a model, and today you compare basket vectors from a purchase log.
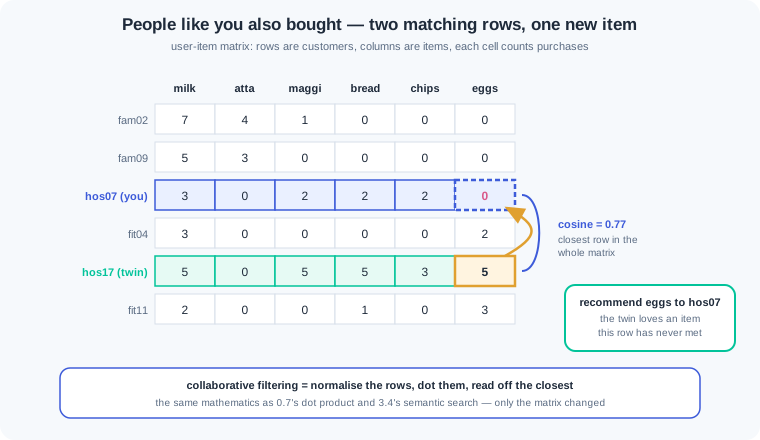
Real systems flip the question from users to items. Item-item similarity — compare the columns of the matrix instead of the rows, finding items that the same people tend to buy. Item pairings are stable: maggi and chips will still travel together next month, while a user's mood changes weekly. So teams precompute the item-similarity table overnight and serve "because you bought X" from it in milliseconds. This variant has powered large e-commerce sites for two decades, and it is the one you will meet at work.
Collaborative filtering has a blind spot: it only knows items that carry history. Content-based recommendation — matching items to a user through item features such as category, brand, price band or genre. A new protein bar has zero sales, but its features place it beside the oats and peanut butter a user already buys. Content-based lists are less surprising, because features only capture what the catalogue team wrote down. The two approaches are teammates, not rivals.
Every recommender meets the cold start — the moment a new user or a new item arrives with no history at all. A new user has an empty row, so nobody is "like" them yet. A new item has an empty column, so no basket pattern can ever surface it. The escapes are plain: most-bought lists for new users, three quick questions at signup, and content features to carry new items until sales arrive. Cold start is no corner case in India — a quick-commerce app entering a new city is one giant cold start.
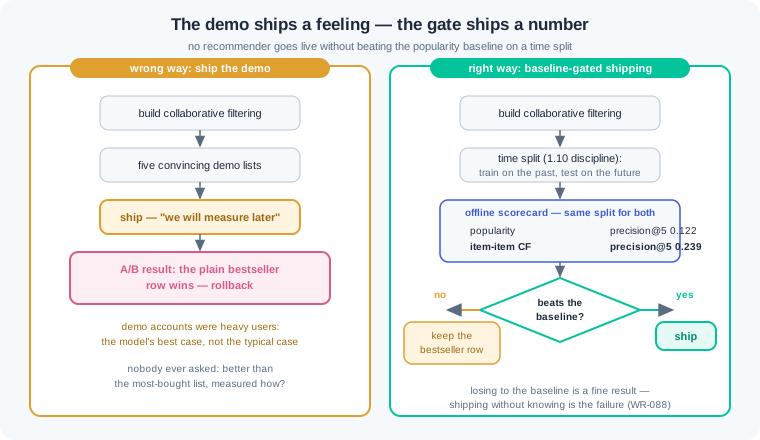
Now the discipline, because shipping on a demo is how these projects die. The wrong way: build collaborative filtering, admire five convincing demo lists, and ship. The right way: split the log by time as 1.10 taught, train on the past, and test on the future. Measure precision@k — the share of your top-k suggestions the user really went on to buy — and hit-rate@k, the share of users for whom at least one landed. Ship only when both beat the popularity baseline on the same split; that gate is the whole lesson of WR-088.
One caution before you build. A recommender trained on its own output chases its tail: whatever it promotes gets bought more, which makes it promote that item harder. Left alone, this feedback loop shrinks attention to a few winners and starves the long tail — WR-090 shows the damage. The same loop on news feeds builds filter bubbles, where users only meet views they already hold. The fixes are cheap: reserve a few list slots for exploration, and track how much of the catalogue your lists actually cover.
Work inside ai-lab. One seeded world for the whole walkthrough: Pooja's quick-commerce customers, built from three hidden household types. User ids carry a fam/hos/fit prefix purely as our answer sheet — the way 1.9 kept its recipe column. Pooja's real table would not have it.
Build the purchase log and the user-item matrix. Sixty customers, twenty items, 120 days of orders — and the last 30 days set aside as the future, before anything else happens:
import numpy as np
import pandas as pd

pd.set_option("display.width", 120)
pd.set_option("display.max_columns", 14)
rng = np.random.default_rng(21)

ITEMS = ["milk", "atta", "toor dal", "rice", "curd", "tea", "sugar", "ghee",
         "poha", "maggi", "bread", "eggs", "chips", "cold drink", "biscuits",
         "oats", "green tea", "peanut butter", "brown bread", "honey"]

PERSONAS = {
    "family":    (25, ["milk", "atta", "toor dal", "rice", "curd", "tea", "sugar", "ghee", "poha"]),
    "hosteller": (20, ["maggi", "bread", "eggs", "chips", "cold drink", "biscuits", "milk", "tea"]),
    "fitness":   (15, ["oats", "green tea", "peanut butter", "brown bread", "honey", "eggs", "curd", "milk"]),
}

def make_events(rng, personas, items, days, orders=30, core_p=0.85):
    rows = []
    for name, (n, core) in personas.items():
        w = 1.0 / np.arange(1, len(core) + 1)
        w = w / w.sum()
        for k in range(n):
            user = f"{name[:3]}{k:02d}"
            for _ in range(rng.poisson(orders)):
                day = int(rng.integers(1, days + 1))
                pick = rng.choice(core, p=w) if rng.random() < core_p else rng.choice(items)
                rows.append((user, pick, day))
    return pd.DataFrame(rows, columns=["user", "item", "day"])

events = make_events(rng, PERSONAS, ITEMS, days=120)
train = events[events["day"] <= 90]
test = events[events["day"] > 90]
mat = train.pivot_table(index="user", columns="item", values="day",
                        aggfunc="count", fill_value=0)
mat = mat.reindex(columns=ITEMS, fill_value=0)
print("events:", len(events), " train:", len(train), " test:", len(test))
print("matrix:", mat.shape)
print(mat.loc[["fam00", "hos00", "fit00"], ["milk", "atta", "maggi", "chips", "oats", "honey"]])
Output: events: 1837 train: 1354 test: 483, then matrix: (60, 20), then a corner of the matrix: fam00 holds milk 7 and atta 4 with zero chips or oats, hos00 holds maggi 4, fit00 holds oats 6 and honey 2. Each row is one customer's basket vector — the same kind of vector 0.7 taught you to dot. The day column exists for one reason: days 91–120 are the sealed future we will judge against, exactly 1.10's split discipline.
The popularity baseline — the incumbent. Count what sold most in the training window:
pop = train["item"].value_counts()
print(pop.head(5))
Output: milk 215, maggi 152, oats 105, atta 97, bread 83. This five-line list is the current "You may also need" row: no model, no similarity, no maths, served to everyone. Do not laugh at it. Milk alone appears in every household type's basket, so this list is somewhat right for almost everybody — that is why it is the bar, and every clever thing below must clear it.
User-user cosine: find a taste twin. Normalise the rows, then @ — the 3.4 reflex applied to baskets:
A = mat.to_numpy(dtype=float)
U = A / np.linalg.norm(A, axis=1, keepdims=True)
sim = U @ U.T
me = mat.index.get_loc("hos07")
scores = sim[me].copy()
scores[me] = -1
twin = mat.index[int(scores.argmax())]
print("taste twin of hos07:", twin, " cosine:", round(float(scores.max()), 2))
pair = mat.loc[["hos07", twin]].T
print(pair[(pair > 0).any(axis=1)])
print("least similar:", mat.index[int(sim[me].argmin())], round(float(sim[me].min()), 2))
Output: taste twin of hos07: hos17 cosine: 0.77, then the two baskets side by side, then least similar: fit04 0.09. Read the pair table like a story. Both buy maggi, bread, chips, biscuits, milk and tea — two hostellers running the same kitchen. But hos17 bought eggs five times, and hos07 has never bought eggs at all: that gap is the entire product idea of collaborative filtering, the item your twin loves that you have not met. And the 0.09 against a fitness-type customer says the matrix knows these two share almost nothing.
Item-item: "because you bought maggi". Now compare columns instead of rows, and score every unseen item for hos07:
V = A / np.linalg.norm(A, axis=0, keepdims=True)
S = V.T @ V
np.fill_diagonal(S, 0.0)

def recommend(user, k=5):
    owned = mat.loc[user].to_numpy(dtype=float)
    score = owned @ S
    score[owned > 0] = -1        # new-to-you items only
    top = np.argsort(score)[::-1][:k]
    return [(ITEMS[i], round(float(score[i]), 2),
             ITEMS[int(np.argmax(S[i] * (owned > 0)))]) for i in top]

for item, sc, because in recommend("hos07"):
    print(f"{item:<12} score {sc:>6}   because you bought {because}")
Output, five lines: eggs 8.13 because you bought maggi, then ghee 7.85, poha 6.98, curd 6.98 and rice 6.7, each traced to milk or toor dal. The top line is the one to frame: maggi-and-eggs is a hostel dinner, and the matrix found it with no food knowledge at all. Notice the honest weakness too — hos07's small milk and dal purchases pull family staples like ghee and poha into his list. Collaborative filtering follows whatever your row already resembles; it cannot know which purchases were one-off. The score[owned > 0] = -1 line matters as much as the maths: without it, the "recommendations" are the user's own weekly basket, a bug WR-088's team met in review.
The gate: time-split precision@5 against the baseline. For every user, we recommend five new-to-them items using only days 1–90, then check what they actually tried in days 91–120:
def precision_at_5(rec_fn):
    hits, users = [], 0
    for user in mat.index:
        seen = set(train.loc[train["user"] == user, "item"])
        new = set(test.loc[test["user"] == user, "item"]) - seen
        if not new:
            continue
        users += 1
        recs = rec_fn(user, seen)
        hits.append(len(set(recs) & new) / 5)
    return users, round(float(np.mean(hits)), 3), round(float(np.mean([h > 0 for h in hits])), 2)

pop_list = pop.index.tolist()
for name, fn in [("popularity", lambda u, s: [i for i in pop_list if i not in s][:5]),
                 ("item-item CF", lambda u, s: [i for i, _, _ in recommend(u)])]:
    users, p5, hr5 = precision_at_5(fn)
    print(f"{name:<14} users {users}  precision@5 {p5}  hit-rate@5 {hr5}")
Output: popularity users 41 precision@5 0.122 hit-rate@5 0.54 and item-item CF users 41 precision@5 0.239 hit-rate@5 0.83. Forty-one of sixty customers tried something new in the final month — only they can score a recommender. The bestseller list still lands a hit for half of them, which is why it earns respect. But CF nearly doubles precision@5 and reaches five customers in six, because our three household types are strong and clean. Real logs are messier and the gap is usually thinner — which is exactly why this gate must be run every time, never assumed.
Work inside ai-lab. Every world is seeded: where a check states a number, your number must match it exactly.
The neighbour table and the normalisation trap. In neighbours.py, rebuild the watch block's world exactly (seed 21, same lists, same split). Part (a): from the train matrix, build the 20×20 item-item cosine table and print every item's nearest neighbour with its score. Part (b): pick five pairs from your table and write the five "because you bought X, try Y" lines you would ship on the item page — choose pairs a Tiruchirappalli customer would find natural, and reject any pair you cannot explain. Part (c): rebuild the same table using raw dot products on the count columns — skip the column normalisation — print every item's top partner again, and count how many items now name milk. Close with three sentences on what normalisation buys, tying it to the rule 3.4 taught for text vectors. Check: part (a) shows milk and atta as mutual nearest neighbours at 0.85, maggi→bread at 0.80, oats→brown bread at 0.82, and honey→peanut butter as the weakest pairing at 0.52; part (c) makes milk the top partner of 8 of the 20 items and flips 6 items' neighbours versus cosine — honey's partner changes from peanut butter to oats; your closing sentences say that raw dot products reward sheer popularity while cosine measures direction, the same reason 3.4 normalised before comparing.
Build the OTT recommender and face the gate. A streaming app wants a "Because you watched" rail, and you own the build and the verdict. In ott.py, reuse the watch block's make_events helper unchanged, with np.random.default_rng(7). Shows, in this exact order: ["Powerplay", "Spin Kings", "Boundary Line", "The Nets", "Final Over", "Dressing Room", "Monsoon Hearts", "Chai and Choices", "Two Weddings", "House of Rangoli", "Paper Lanterns", "Postcards Home", "Nightbeat", "The Ledger", "Cold File", "Harbour Road", "Missing Page", "The Third Key", "Local Train", "Exam Fever"]. Personas, in this exact order: "sports" — 18 users, core ["Powerplay", "Spin Kings", "Boundary Line", "The Nets", "Final Over", "Dressing Room", "Local Train"]; "romance" — 16 users, core ["Monsoon Hearts", "Chai and Choices", "Two Weddings", "House of Rangoli", "Paper Lanterns", "Postcards Home", "Local Train"]; "thriller" — 16 users, core ["Nightbeat", "The Ledger", "Cold File", "Harbour Road", "Missing Page", "The Third Key", "Exam Fever"]. Generate with days=84, train on day ≤ 63, test on the rest, and build the count matrix reindexed to the show list's order. Print the popularity top-5, build the item-item cosine table, recommend five unseen shows per user, and score popularity versus CF with precision@5 and hit-rate@5 over users who watched something new in the test weeks. Close with a verdict paragraph: which recommender wins, by how much, why the gap is smaller than the kirana world's, and whether you would ship. Check: 1546 events and a 50×20 matrix; the popularity top-5 is led by Powerplay at 152 plays, Monsoon Hearts at 134 and Nightbeat at 127; over the 30 scoreable users, popularity gets precision@5 0.127 with hit-rate@5 0.53 while item-item CF gets 0.173 and 0.73; Nightbeat's nearest neighbour is Cold File at 0.84; your verdict ships CF because it beats the baseline on both numbers, and names the two shared shows — Local Train and Exam Fever — as the reason popularity stays competitive here.
The cold-start playbook. Write coldstart.md, the serving plan Pooja's app will follow when history runs out — three concrete cases, each ending with one metric that proves the escape is working. Case 1, brand-new user: state what the "You may also need" row shows on their very first order, write the actual three onboarding questions you would put on the signup screen, and name the trigger that switches this user to collaborative lists. Case 2, brand-new item: a private-label peanut chikki launches with zero sales; write how it earns its first views — which content features place it near existing snacks, which rails it may appear in, and how large its forced exploration slot is — plus the trigger for trusting its own history. Case 3, brand-new city: the app launches where every user and every item-history is new; write the day-one plan, what transfers from existing cities and what must not, and the week-by-week path back to personalised lists. Check: case 1 serves the popularity baseline on day one and asks three questions a real signup screen could show; case 2 places the chikki by content features beside existing snacks with a small exploration slot, and never relies on a pure collaborative rail; case 3 seeds the city with popularity and content lists borrowed from similar cities, keeps user-level collaborative filtering off until local baskets accumulate, and names its switch trigger; every case ends with a measurable signal — such as new-cohort hit-rate@5, the chikki's first-week click-through, or city-level precision@5 once a time split becomes possible.
Three recommender failures cover most of what this lesson meets in production. Each has a War Room entry with the full diagnosis path:
- WR-088 — the fancy model that lost to the bestseller list. A collaborative filter shipped on demo applause with no offline gate, and the A/B test showed the plain popularity row beating it; a time-split precision@k scorecard against the baseline, run before shipping, is the fix and the habit.
- WR-089 — the stale twin. An item-similarity table computed once at launch was never refreshed, so the app recommended last season for months while click-through quietly slid; a recompute cadence with freshness monitoring is the way back.
- WR-090 — the feedback loop that ate the catalogue. Recommending only popular items made them more popular in the next training set, until the long tail stopped selling entirely; exploration slots and catalogue-coverage checks break the loop.
A recommender turns one user's history into a short ranked list. The most-bought list comes first, and every clever model must prove it beats that bar. Collaborative filtering finds users with matching baskets in the user-item matrix, scored with the cosine maths from 0.7 and 3.4. Item-item similarity compares columns instead, so teams precompute which items travel together and serve "because you bought X" from that table. Cover the cold start with most-bought lists, content features and three signup questions, then judge on a time split with precision@k against the baseline.
- Quick-commerce and e-commerce apps in India build their "people also bought" rails from basket history — the same item-item table you built today, refreshed nightly.
- OTT and music platforms rank each home row per profile, and the pick-three-genres signup screen is the cold-start escape working in the wild.
- B2B kirana apps suggest restock lists by comparing shops' order histories — the users in the matrix are shops, and the maths does not change.
Answer these before opening the gate assessment. Each question names its type.
type=output-prediction— A count matrix has columns [atta, maggi, eggs, chips]. Target user T = [0, 4, 3, 0]; candidate A = [6, 0, 1, 0]; candidate B = [0, 5, 4, 3]. Predict which candidate is T's taste twin under cosine similarity, roughly how far apart the two scores are, and which single item an item-item recommender would put first for T — with its "because you bought" item.type=debug— A teammate's "people also bought" rail keeps showing customers the same milk and atta they already buy weekly, and taps are near zero. Their code scores every item withowned @ Sand takes the top five. Name the missing step, give the one-line fix, and explain why this bug made the demo look convincing to the team.type=interpretation— A time-split table reads: popularity precision@5 0.14, hit-rate@5 0.51; item-item CF precision@5 0.15, hit-rate@5 0.53. The CF path costs a nightly similarity job plus new serving code. Read the table as a gate decision: what do the numbers actually claim, what ships this quarter, and what would you try before re-running the gate?type=scenario-judgement— Demo day. The founder loves the collaborative lists shown on four handpicked heavy-user accounts and says: ship this week, we will measure after launch. The offline gate was never run. Judge the plan, name the cheapest evidence you would demand first, and state what WR-088 predicts if it ships as-is.type=trade-off— A fashion marketplace replaces 30 percent of its catalogue every month. For its "similar items" rail, compare item-item collaborative filtering against content-based recommendation: one concrete strength and one concrete cost of each, then describe the blend you would actually run.
Explain to a friend who runs a kirana shop how you would choose five extra items to suggest to a regular customer: start from the bestseller shelf, then find customers whose khata looks like this customer's khata and offer what those people buy that this customer does not, and only trust the trick once it beats the bestseller shelf on last month's bills. Use at most 4 sentences and plain words — "people with similar baskets" is allowed, "cosine similarity" is not. If your friend can say why the bestseller shelf comes first, you own this module.