Monitoring
Harini runs the churn service for an NBFC from Tirupati. It has been live on App Runner for three months, and the deploy pipeline has stayed green. Then the quarterly business review lands. Field agents in Jalandhar lost forty customers the model never flagged. She checks the service: every request answered 200, latency steady, error rate near zero, not one alert. The model had been wrong quietly, and nothing was watching for wrong. Her lead writes one line on the board: deployed is not done.
- Every module since 4.1 ends at a working service, and 4.7 put it on the open internet. This module is the difference between shipping a model and running one — the part that keeps it good after launch day.
- Interviewers ask one question that separates course projects from real ones: "how do you know your model is still good in production?" After today you answer with three layers and real numbers.
- Indian MLOps and GenAI job posts name monitoring and observability by name. And under the DPDP Act, logging discipline is a legal skill, not only a technical one.
The churn service passed the 4.5 gate, shipped through 4.6, and answers on 4.7's cloud URL. None of that protects it from next month. The world that made the training data keeps moving: incomes shift, ordering habits change, a rival app launches in two cities. The model keeps scoring the new world with the old rules, and HTTP has no status code for "correct". A wrong prediction and a right one both return 200.
Monitoring is the discipline of watching a live system for trouble it will not report itself. For an ML service the watch has three layers, and each answers one question. Service health asks: is the service up, fast, and free of errors? Data drift asks: does today's incoming data still look like the training data? Outcome quality asks: are the predictions still right, once the truth arrives?
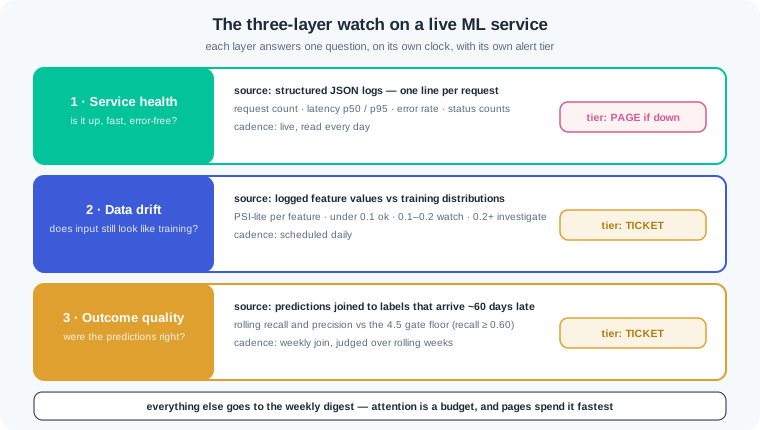
Layer one lives on data you already produce: logs. Structured logging — writing every log line as named fields, one JSON object per line — turns the log from a story into a table. From one day of lines, pandas can count requests, split status codes, and time every call. Speed is read as a percentile — the value that a given share of requests stays under. The p50 is the typical request, and the p95 is what your slowest twentieth of callers feels, the same honest pair 4.2 taught you to measure.
Logs carry risk as well as truth, because whatever you log is stored. Module 3.11's rule holds at this layer: no raw personal data in logs, ever. Our middleware logs a whitelist of model fields plus an opaque reference code, and any free text must pass redaction first. Under the DPDP Act a log file is stored personal data, and WR-114 shows how a "harmless" request log became a leak.
Layer two compares shapes. Data drift — incoming data moving away from the data the model trained on — is the earliest warning you can buy. You cannot eyeball a million rows, so each feature gets one number: PSI — the population stability index, a score for how far a feature's distribution has moved. Our PSI-lite version needs only pandas and numpy: bin the training values, bin the live values, and sum a weighted log ratio. Below 0.1 is calm, 0.1 to 0.2 is worth watching, and 0.2 or more says investigate.
Layer three waits for the truth. Concept drift — the link between the features and the outcome changing — cannot be seen in the inputs alone. For churn the truth arrives about 60 days late: only then do you know who really left. So the monitor joins old predictions to the outcomes that have arrived and scores a rolling recall. The 4.5 gate floor of 0.60 recall gets a second job: it judged the model before shipping, and it judges the same model every week after.
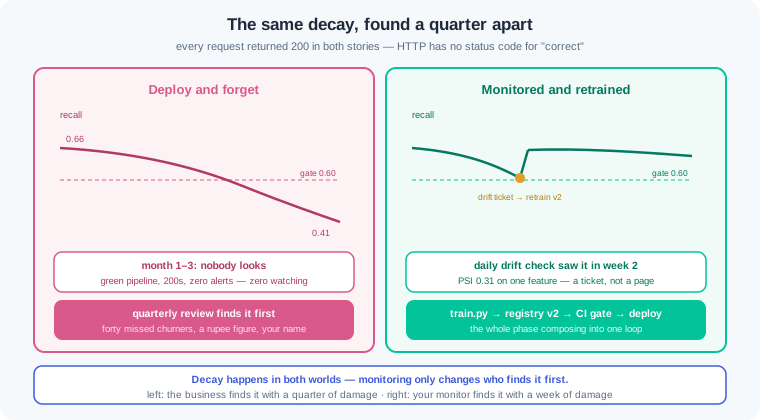
Here is the contrast that decides whether decay is caught in a week or in a quarter. The wrong way is deploy-and-forget: the service returns 200s for months, and the first monitor is a quarterly business report full of missed churners. By then the damage has a rupee figure and your name on it. The right way is the three-layer watch: a log line on every request, a drift check every day, an outcome join every week. Decay still happens — the difference is who finds it first, you or the business.
Alerts spend from a budget of human attention, and that account runs dry fast. Alert fatigue — a team ignoring alerts because most turned out to be noise — is a failure mode as real as an outage, and WR-113 shows it swallowing a real incident. So alerts come in tiers. Page a human now only when the service is down or errors spike. Raise a ticket for drift and gate failures, and fold everything else into a weekly digest.
A dashboard earns its place by fitting on one screen. Ours shows six things: request count, p50 and p95 latency, error rate, per-feature PSI, and rolling recall against the gate line. If a number would not change a decision, it does not belong. A wall of forty charts is where problems hide, not where they are found.
Monitoring ends with a decision: when do we retrain? Three triggers cover it — a drift score over threshold, a calendar deadline, or a measured performance drop. Retraining is not new machinery: it is 4.1's train.py rerun on fresher data, 4.4's registry taking version 2, and 4.6's pipeline gating and shipping it. The whole phase composes into one loop: train, serve, watch, retrain.
Work inside churn-repo with the 4.2 service runnable and the 4.5 suite green. Logs go to stdout on purpose: 4.7 showed you that stdout is exactly what CloudWatch collects from App Runner, so the same lines work on your laptop and in the cloud.
Step 1 — structured logging in the FastAPI app. One new file, two wiring lines, one whitelist:
# app/monitoring.py — one JSON line per request, whitelist enforced
import json
import sys
import time

SAFE_FIELDS = ["city", "monthly_income", "orders_last_90d",
               "avg_order_value", "last_order_date"]   # nothing else, ever


def emit(record):
    record["ts"] = time.strftime("%Y-%m-%dT%H:%M:%SZ", time.gmtime())
    sys.stdout.write(json.dumps(record, default=str) + "\n")  # stdout -> CloudWatch


async def access_log(request, call_next):
    t0 = time.perf_counter()
    response = await call_next(request)
    emit({"event": "request", "method": request.method,
          "path": request.url.path, "status": response.status_code,
          "latency_ms": round((time.perf_counter() - t0) * 1000, 1)})
    return response

# --- additions to app/main.py ---
# from app.monitoring import emit, access_log, SAFE_FIELDS
# app.middleware("http")(access_log)
#
# CustomerIn gains one field the app team already holds:
#   ref: str = Field(pattern=r"^[a-f0-9]{6}$")   # opaque customer reference
#
# inside predict(), after prob is computed:
#   emit({"event": "prediction", "ref": customer.ref,
#         **{k: customer.model_dump()[k] for k in SAFE_FIELDS},
#         "prediction": int(prob >= 0.5), "churn_prob": round(float(prob), 2)})
Two kinds of line come out of this. The middleware times every request — including the 422s that never reach your code — and records method, path, status and latency. The predict endpoint adds a second line carrying the model's inputs and verdict, because layer two needs incoming feature values and layer three needs ref, the opaque code the app team can map back to a customer while we cannot. The whitelist is the DPDP discipline made mechanical: a field the app team adds next month is dropped by default, not logged by accident.
Before you run anything, know what you have just done to your callers: ref is now a required field, so every payload written before today is out of contract. The 4.5 suite goes red with 422s, the golden curl gets a 422 too, and a push would have the 4.6 pipeline block the merge — which is the gate doing its job, because this is exactly what a breaking contract change looks like from the caller's side. The fix is one line per payload — add "ref": "c81f3a" (any six hex characters) to the smoke request and to each test payload — and the suite goes green again. Red, fix, green: you have walked the smallest possible breaking change through CI, and the clients of a real service would need the same memo before this deploy.
Step 2 — read what the service now says, and what it refuses to say:
{"event": "request", "method": "POST", "path": "/predict", "status": 200,
 "latency_ms": 11.8, "ts": "2026-08-11T10:14:03Z"}
{"event": "prediction", "ref": "c81f3a", "city": "Jalandhar",
 "monthly_income": 24000, "orders_last_90d": 1, "avg_order_value": 650,
 "last_order_date": "2026-03-02", "prediction": 1, "churn_prob": 0.7,
 "ts": "2026-08-11T10:14:03Z"}

# The app team proposes forwarding their CRM note in the payload:
#     "note": "spoke to Ramesh Kumar, call back on 9876543210"
# The whitelist drops the field entirely. If free text were ever truly
# needed, it would pass 3.11's redact() first and land as:
#     "note": "spoke to Ramesh Kumar, call back on [PHONE]"
# -- and the name still survives. Regex redaction is a floor;
#    the whitelist is the real wall. Do not log free text.

# In production, the same lines are already in CloudWatch (4.7):
$ aws logs tail /aws/apprunner/churn-live/f31a9c.../application --since 5m
2026-08-11T10:14:03 {"event": "request", "path": "/predict", "status": 200, ...}
2026-08-11T10:14:03 {"event": "prediction", "ref": "c81f3a", "churn_prob": 0.7, ...}
Read the Jalandhar line: the golden customer from 4.1 now leaves a machine-readable trace with churn_prob 0.7 — same model, same verdict, now with a memory. Read the CRM note twice: even after redaction, "Ramesh Kumar" is still personal data in a stored file. That is WR-114's leak in miniature, and it is why the whitelist, not the redactor, is the primary defence. The aws logs tail at the bottom is the payoff of logging to stdout: no new infrastructure, the lines are already collected where 4.7 left them.
Step 3 — service health from a day of logs. Save a day of stdout as logs/2026-08-11.jsonl, then let pandas read the table your logs became:
# monitor/health.py — one day of logs -> the service-health report
import json
import sys

import pandas as pd

lines = [json.loads(l) for l in open(sys.argv[1], encoding="utf-8")]
req = pd.DataFrame([l for l in lines if l["event"] == "request"])

lat = req.loc[req["path"] == "/predict", "latency_ms"].sort_values()
counts = req["status"].value_counts().sort_index()
n_err = int((req["status"] >= 500).sum())

print(f"requests: {len(req)}   /predict calls: {len(lat)}")
print(f"latency  p50: {lat.quantile(.50):.0f} ms   "
      f"p95: {lat.quantile(.95):.0f} ms   worst: {lat.max():.0f} ms")
print("status   " + "   ".join(f"{s}: {n}" for s, n in counts.items()))
print(f"error rate: {n_err / len(req):.2%}  ({n_err} of {len(req)})")
Run it on the day the scene described as "fine":
$ python monitor/health.py logs/2026-08-11.jsonl
requests: 1842   /predict calls: 1793
latency  p50: 12 ms   p95: 19 ms   worst: 214 ms
status   200: 1741   422: 49   500: 3
error rate: 0.16%  (3 of 1842)
Layer one really is healthy, which is the point of the module: healthy is not the same as correct. Read each number like an operator. The p50 of 12 ms matches what you measured in 4.2, and the p95 of 19 ms says even slow callers are fine; the 214 ms worst is the cold start after a restart, reported separately exactly as 4.2 taught. The 49 status-422 lines are callers' mistakes — the 4.2 contract doing its job — while the 3 five-hundreds are yours: three stack traces waiting in the log. Only the error rate and latency belong to the page-level alerts; nothing here can see a rotting model.
Step 4 — layers two and three: drift and the late-arriving truth. Two short scripts complete the watch:
# monitor/drift.py — PSI-lite per feature: training week vs the last 7 days
import json

import numpy as np
import pandas as pd

from src.data import load_customers


def psi_lite(train, live, bins=10):
    edges = np.quantile(train, np.linspace(0, 1, bins + 1))
    edges[0], edges[-1] = -np.inf, np.inf
    expected = np.histogram(train, edges)[0] / len(train)
    actual = np.histogram(live, edges)[0] / len(live)
    expected = np.clip(expected, 1e-4, None)
    actual = np.clip(actual, 1e-4, None)
    return float(((actual - expected) * np.log(actual / expected)).sum())


train = load_customers()                      # the seeded 4.1 world = training shape
live = pd.DataFrame(json.loads(l) for l in open("logs/week.jsonl")
                    if '"event": "prediction"' in l)
for col in ["monthly_income", "orders_last_90d", "avg_order_value"]:
    s = psi_lite(train[col], live[col])
    tag = "DRIFT" if s >= 0.2 else ("watch" if s >= 0.1 else "ok")
    print(f"{col:18s} {s:5.2f}  {tag}")

# monitor/outcomes.py — join old predictions to the truth that arrived
preds = pd.read_json("logs/predictions.jsonl", lines=True)
truth = pd.read_csv("data/outcomes.csv")      # ref, churned — lands ~60 days late
joined = preds.merge(truth, on="ref")
joined["week"] = pd.to_datetime(joined["ts"]).dt.to_period("W")
weekly = joined.groupby("week").apply(
    lambda g: pd.Series({"joined": len(g),
                         "recall": (g["prediction"] & g["churned"]).sum()
                                   / max(g["churned"].sum(), 1)}))
print(weekly.tail(4).round(2))
The daily run, and what it decides:
$ python monitor/drift.py
monthly_income      0.04  ok
orders_last_90d     0.31  DRIFT
avg_order_value     0.08  ok

$ python monitor/outcomes.py
                        joined  recall
week
2026-06-01/2026-06-07    412.0    0.66
2026-06-08/2026-06-14    405.0    0.63
2026-06-15/2026-06-21    398.0    0.58
2026-06-22/2026-06-28    401.0    0.55

today's alert decisions (thresholds from ALERTS.md)
page   - service down, or error rate > 2%           : no   (0.16%)
ticket - any feature PSI >= 0.2                     : YES  (orders_last_90d 0.31)
ticket - rolling recall < 0.60 gate for 2+ weeks    : YES  (0.58, 0.55)
digest - everything else                            : Friday summary
Hold the two tables together and the story of the scene appears. The PSI check binned each feature's training values into ten quantile buckets, dropped this week's values into the same buckets, and scored the movement: incomes and order values sit where they always did, but orders_last_90d has moved hard — 0.31 — because a rival app launched and ordering habits changed. The recall table is older news on purpose: labels trail by 60 days, so the freshest recall you can score today is late June's, and it has been under the 0.60 gate floor from 4.5 for two weeks. Drift is the early warning about today; recall is the confirmation about last quarter — together they beat any business review to the truth. The decision block turns findings into tiers: no page, because the service itself is healthy; two tickets, because the model is not; and everything else waits for Friday. The response is the loop this phase built: pull fresher labelled data, rerun 4.1's train.py, let 4.4's registry mint version 2, let the 4.6 gate judge it, and let the pipeline ship it to 4.7's URL.
Work inside churn-repo with the venv active and the 4.2 service runnable. Everything runs on your laptop — no AWS account needed; in production the same scripts read CloudWatch exports instead of local files.
One line per request. Add app/monitoring.py and the wiring from watch step 1: the access-log middleware, the ref field on CustomerIn, and the whitelisted prediction line in predict(). Run the service with stdout captured to logs/day1.jsonl, then send twenty mixed requests with a small script: twelve valid customers, five contract-breakers that earn 422s, and three with a last_order_date after the snapshot (400). Try to smuggle PII: add a "note" field with a made-up name and phone number to two payloads and confirm what the log shows. Check: every valid /predict call produced exactly two lines (one request, one prediction) and every 422 produced a request line only — the model never ran; grep -E '[0-9]{10}' logs/day1.jsonl finds no phone-shaped number anywhere; the Jalandhar golden customer's line shows churn_prob: 0.7; one sentence in notes-4.8.md states why the whitelist, not extra="forbid", is what kept the note out of the log.
The full monitor. Build the complete daily monitor for your own service. Write scripts/simulate_traffic.py that replays 2,000 customers sampled (seeded) from the 4.1 world through the running service with the requests library, saving stdout as logs/week.jsonl and each prediction line also to logs/predictions.jsonl. Build data/outcomes.csv from the seeded world's labels keyed by ref. Then write monitor/health.py, monitor/drift.py and monitor/outcomes.py as in the watch section, plus monitor/daily_report.py that runs all three and prints one screen: traffic, p50/p95 latency, error rate, per-feature PSI, rolling recall vs the 0.60 gate, and the alert-decision block. Check: the whole report fits in 25 lines; on the undrifted replay every feature's PSI is below 0.1 and rolling recall sits within 0.03 of the 0.667 you have carried since 4.1; the decision block prints no page and no ticket for this calm day; running the report twice on the same logs prints identical numbers.
The drift drill. Write scripts/make_drift_weeks.py: it generates three weeks of request traffic where weeks 1 and 2 are sampled from the training world, and week 3 shifts exactly two named features — monthly_income drops about 30% (a new low-income customer segment) and orders_last_90d falls sharply (the rival-app story) — while avg_order_value and city shares stay untouched. Replay all three weeks through the service, then run your monitor on each week separately. Draft the alert your monitor should raise for week 3 in alerts/2026-W33.md: tier, evidence, and the question it puts to the team. Check: weeks 1 and 2 show every feature under 0.1; week 3 flags monthly_income and orders_last_90d at PSI ≥ 0.2 and nothing else — a monitor that flags a third feature or misses one fails the drill; the drafted alert is a ticket, not a page, and says why in one line; it names both features with their scores and ends by proposing a retrain check, not announcing an outage.
Alert policy and the retrain trigger. Write ALERTS.md: three tiers (page, ticket, digest) with numeric thresholds and headroom — the page threshold must sit far enough from normal that a single slow request can never fire it. Apply the policy on paper to five days: (a) error rate 4.1% for ten minutes, (b) p95 up from 19 ms to 31 ms, (c) one feature at PSI 0.24, (d) rolling recall 0.57 for the second week, (e) a quiet day. Then write RETRAIN.md naming the three triggers with numbers — sustained PSI ≥ 0.2, calendar older than 90 days, rolling recall under the 0.60 gate for two weeks — and walk one full retrain locally: rerun train.py on regenerated data, register the model as churn-model version 2 (4.4), run pytest -q so the 4.5 gate judges it, and move the production alias. Check: each of the five days maps to exactly one tier with a one-line reason, and only day (a) pages; RETRAIN.md names all three triggers with numbers and the module that executes each step; the walk ends with churn-model version 2 holding the production alias and the suite green — the whole phase composed by hand once, before any scheduler does it for you.
Three monitoring failures cover most of what a first on-call month meets. Each has a War Room entry with the full diagnosis path:
- WR-112 — the quiet decay. A churn model served clean 200s for a whole quarter while its recall rotted from 0.66 to 0.41; a business review, not an engineer, found it. Outcome joins and a daily drift check from day one make the monitor the first to know, not the last.
- WR-113 — the pager that cried wolf. Paging on every latency blip and every single 500 trained a team to swipe alerts away, so the night the service really died, the page was ignored too. Tiered alerts with headroom — page only for down, tickets for drift — rebuilt trust in the pager.
- WR-114 — the log that leaked. Request logs carrying raw phone numbers flowed into a vendor dashboard nobody vetted, turning a debugging aid into DPDP exposure. Whitelist logging with redaction at the boundary, plus a retention limit, closed the leak at the layer it started.
Deployed is not done, because a served model decays quietly while every request still returns 200. Three layers watch three different failures: service health read from structured logs, data drift scored against the training distributions, and outcome quality once the late labels arrive. A PSI-lite score per feature turns data change into one number, and a rolling recall from the 60-day-late truth judges the model against the same 0.60 gate it passed before shipping. Alerts must respect human attention: page only when the service is down, raise tickets for drift and gate failures, and fold the rest into a weekly digest. When drift, the calendar, or a recall drop says retrain, the phase composes: train.py reruns, the registry takes a new version, and the pipeline gates and ships it.
- UPI fraud models. Fraud patterns shift weekly because fraudsters adapt, so Indian banks run drift dashboards and fast retrain loops around their scorers. Their alert tiers are tuned hard, because a page at 3 in the morning must mean a real attack, not a noisy threshold.
- Quick-commerce in festival season. A demand or churn model trained on monsoon-quarter data meets Diwali traffic: order values and frequencies drift together, on schedule. Monitoring with per-feature scores is how teams tell a festival from a failure — and why many schedule retrains before the season, not after it.
- Hosted model APIs. The status pages and p95 charts published by the LLM providers you called in 3.2 are layer one at world scale, and their teams watch output-quality regressions the way you watch recall. Cost per request sits on the same dashboards, which is where module 4.9 picks up.
Answer these before opening the gate assessment. Each question names its kind.
type=output-prediction— Next week a festival doublesorders_last_90dfor most customers while incomes and order values hold steady. Predict the drift table: which rows read ok, watch, or DRIFT; what the alert-decision block prints; and what this week's rolling-recall table can say about the festival's effect on the model.type=debug— The daily report shows healthy traffic and a normal drift table, but the rolling-recall table has printed no new rows for five weeks. The service is up andpredictions.jsonlis growing. Name the two most likely breaks in the outcome join, the one file and one field you would inspect first, and the check that would have caught this the week it started.type=interpretation— A morning report reads: requests 1,910; p50 11 ms; p95 18 ms; error rate 0.1%; PSI — monthly_income 0.27, orders_last_90d 0.24, avg_order_value 0.22; rolling recall 0.65. Explain what pattern of change makes every feature drift at once while recall still holds, which tier this raises, and what you would compare the live rows against before believing the model is in danger.type=scenario-judgement— After the WR-112 scare, a teammate proposes paging the on-call phone for every feature PSI above 0.1 and every single 500. Judge the proposal, name the failure mode it invites and the War Room entry that documents it, and redesign the same signals into the correct tiers.type=trade-off— Retraining on a fixed monthly calendar versus retraining only when drift or recall triggers fire: give one concrete gain and one concrete cost of each, pick a policy for Harini's churn service where labels arrive 60 days late, and name the number you would watch to revisit the choice.
Explain to a friend who runs a kirana shop why a shop that opened well still needs an evening ritual. Every night she counts the till, so she knows the day went through cleanly. Every week she notices what customers are asking for that she does not stock, because the neighbourhood changes before the shelves do. And at month-end she checks who repaid their credit khata, because that truth arrives late but decides everything. Use at most 4 sentences and no computer words. If she can say why the till, the shelf and the khata are three different checks, you own this module.